Edit chart
Loading graph
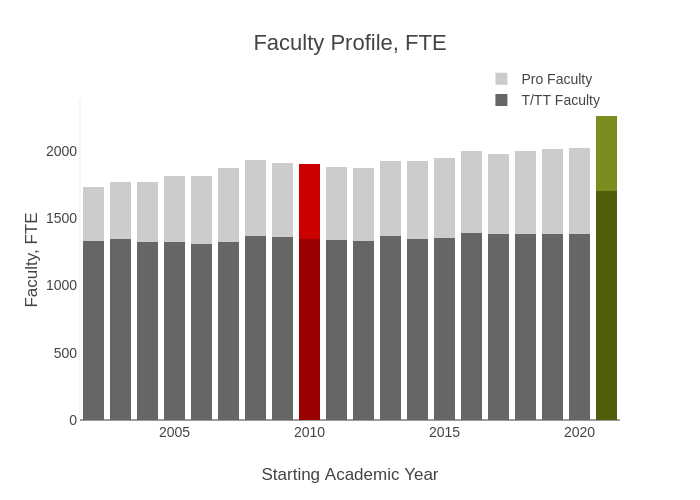
Provostncstate's interactive graph and data of "Faculty Profile, FTE" is a stacked bar chart, showing T/TT Faculty, Pro Faculty, T/TT Faculty Baseline, NTT Faculty Baseline, T/TT Goal, NTT Goal; with Starting Academic Year in the x-axis and Faculty, FTE in the y-axis.. The x-axis shows values from 2001.5 to 2021.5. The y-axis shows values from 0 to 2378.9473684210525.